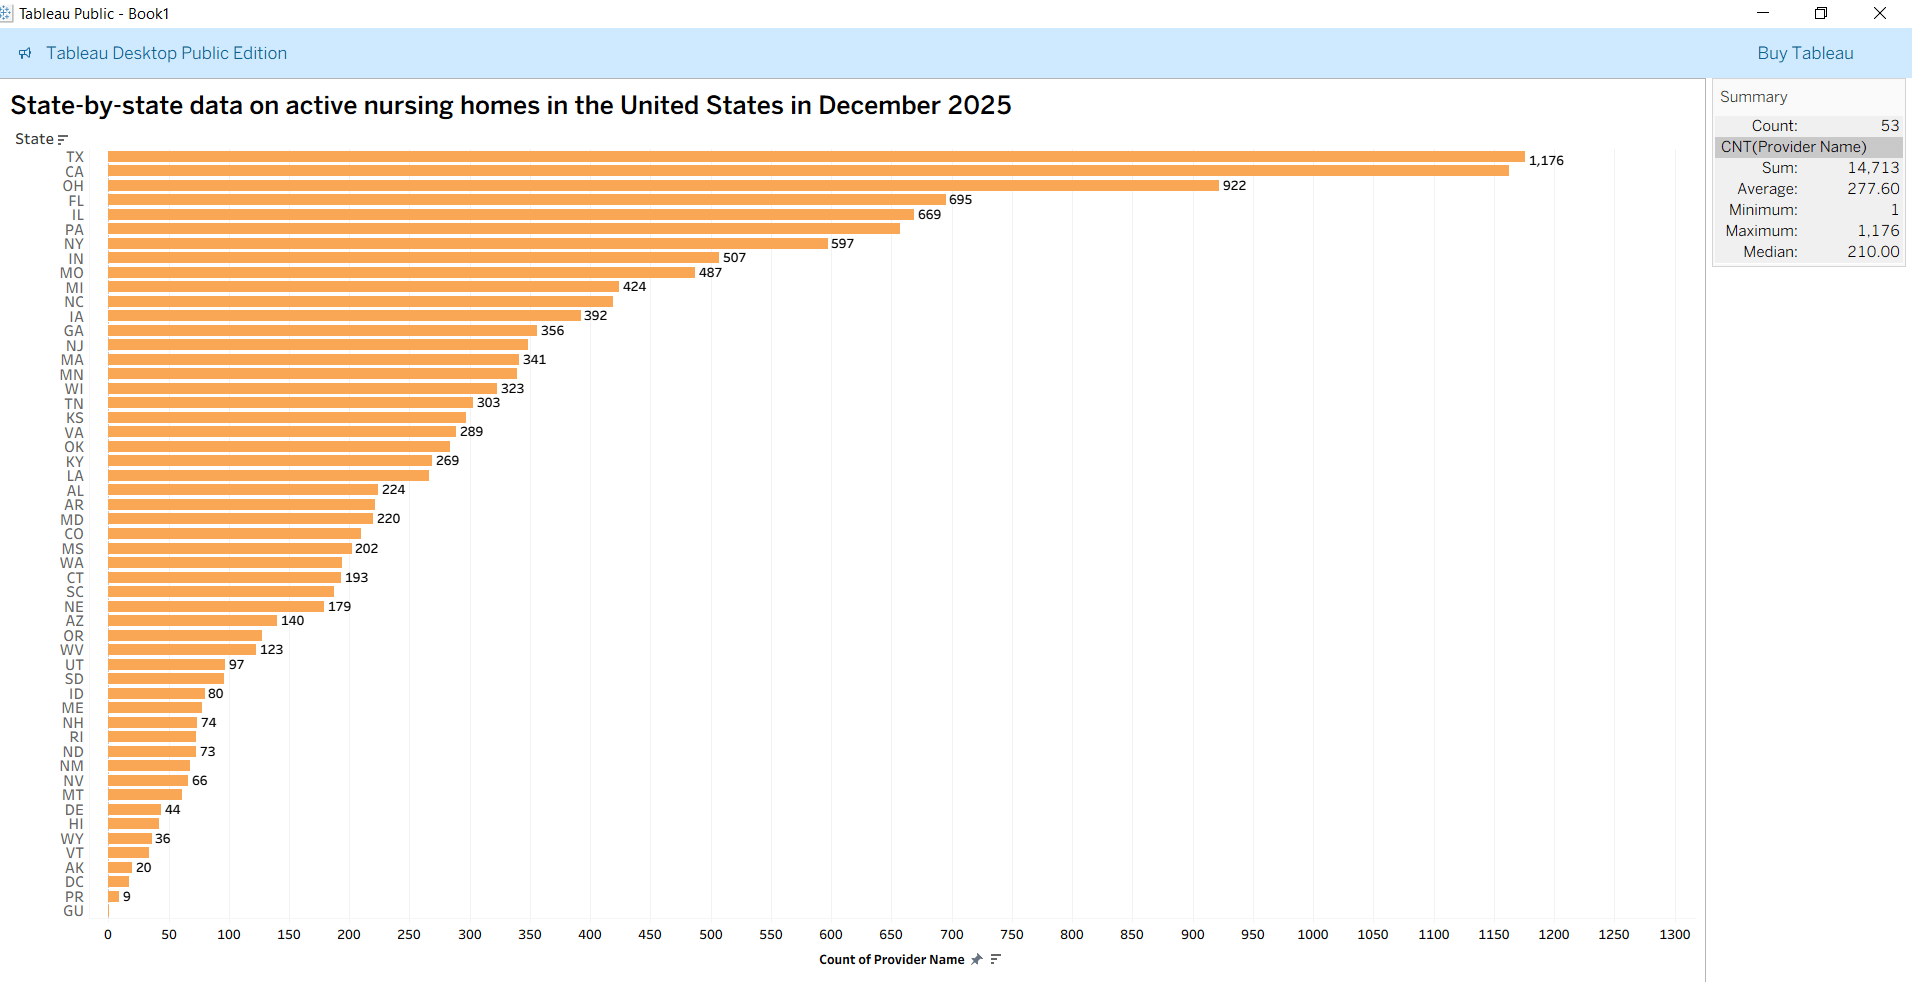
Number of Nursing Centers and Nurse Staffing Hours by State (United States)
Below is the data for nursing centers and nurse staffing hours per resident across various states in the United States. This data is sourced from the Centers for Medicare & Medicaid Services (CMS) Provider Data.
| State | Number of Nursing Centers | Total Nurse Staffing Hours per Resident per Day | (Each nursing center spends an average of hours per resident) |
|---|---|---|---|
| Texas (TX) | 1,176 | 3,907.88 | 3 hours |
| California (CA) | 1,163 | 5,111.52 | 4 hours |
| Ohio (OH) | 922 | 3,398.37 | 4 hours |
| Florida (FL) | 695 | 2,646.31 | 4 hours |
| Illinois (IL) | 669 | 2,305.06 | 3 hours |
| Pennsylvania (PA) | 657 | 2,501.26 | 4 hours |
| New York (NY) | 597 | 2,172.96 | 4 hours |
| Indiana (IN) | 507 | 1,878.14 | 4 hours |
| Missouri (MO) | 487 | 1,629.84 | 3 hours |
| Michigan (MI) | 424 | 1,689.13 | 4 hours |
| North Carolina (NC) | 419 | 1,529.37 | 4 hours |
| Iowa (IA) | 392 | 1,449.55 | 4 hours |
| Georgia (GA) | 356 | 1,265.35 | 4 hours |
| New Jersey (NJ) | 348 | 1,341.57 | 4 hours |
| Massachusetts (MA) | 341 | 1,307.80 | 4 hours |
| Minnesota (MN) | 339 | 1,413.60 | 4 hours |
| Wisconsin (WI) | 323 | 1,337.78 | 4 hours |
| Tennessee (TN) | 303 | 1,135.74 | 4 hours |
| Kansas (KS) | 297 | 1,201.26 | 4 hours |
| Virginia (VA) | 289 | 1,082.29 | 4 hours |
| Oklahoma (OK) | 284 | 1,019.07 | 4 hours |
| Kentucky (KY) | 269 | 1,043.03 | 4 hours |
| Louisiana (LA) | 266 | 972.57 | 4 hours |
| Alabama (AL) | 224 | 873.27 | 4 hours |
| Arkansas (AR) | 221 | 877.07 | 4 hours |
| Maryland (MD) | 220 | 850.33 | 4 hours |
| Colorado (CO) | 210 | 752.70 | 4 hours |
| Mississippi (MS) | 202 | 800.31 | 4 hours |
| Washington (WA) | 194 | 843.98 | 4 hours |
| Connecticut (CT) | 193 | 717.59 | 4 hours |
| South Carolina (SC) | 187 | 701.11 | 4 hours |
| Nebraska (NE) | 179 | 718.34 | 4 hours |
| Arizona (AZ) | 140 | 558.50 | 4 hours |
| Oregon (OR) | 128 | 632.74 | 5 hours |
| West Virginia (WV) | 123 | 439.03 | 4 hours |
| Utah (UT) | 97 | 388.22 | 4 hours |
| South Dakota (SD) | 96 | 361.22 | 4 hours |
| Idaho (ID) | 80 | 327.55 | 4 hours |
| Maine (ME) | 78 | 338.06 | 4 hours |
| New Hampshire (NH) | 74 | 291.78 | 4 hours |
| Rhode Island (RI) | 73 | 263.04 | 4 hours |
| North Dakota (ND) | 73 | 332.42 | 5 hours |
| New Mexico (NM) | 68 | 245.64 | 4 hours |
| Nevada (NV) | 66 | 279.01 | 4 hours |
| Montana (MT) | 61 | 219.89 | 4 hours |
| Delaware (DE) | 44 | 196.98 | 4 hours |
| Hawaii (HI) | 42 | 184.73 | 4 hours |
| Wyoming (WY) | 36 | 136.60 | 4 hours |
| Vermont (VT) | 34 | 134.26 | 4 hours |
| Alaska (AK) | 20 | 130.07 | 7 hours |
| District of Columbia (DC) | 17 | 70.97 | 4 hours |
| Puerto Rico (PR) | 9 | 29.94 | 3 hours |
| Guam (GU) | 1 | 7.65 | 8 hours |
Grand Total of Nursing Centers Across the United States: 14,713
Simplify Your Credentialing Process
Stop delays. Avoid rejections. Get paid faster.
Our credentialing experts manage the entire process—from enrollment to approval.
Urban vs Rural Nursing Centers by State in the United States
Nursing centers across the United States are not evenly distributed. Some states have most of their facilities concentrated in urban areas, while others rely heavily on rural nursing centers to serve smaller communities.
Below is a clear breakdown of Urban vs Rural Nursing Centers by State, along with the total number of nursing centers in each state/territory.
State-Wise Breakdown: Urban, Rural, and Total Nursing Centers
| State | Urban | Rural | Total |
|---|---|---|---|
| Alaska (AK) | 6 | 14 | 20 |
| Alabama (AL) | 149 | 75 | 224 |
| Arkansas (AR) | 109 | 112 | 221 |
| Arizona (AZ) | 131 | 9 | 140 |
| California (CA) | 1126 | 37 | 1163 |
| Colorado (CO) | 155 | 55 | 210 |
| Connecticut (CT) | 182 | 11 | 193 |
| District of Columbia (DC) | 17 | 0 | 17 |
| Delaware (DE) | 32 | 12 | 44 |
| Florida (FL) | 660 | 35 | 695 |
| Georgia (GA) | 227 | 129 | 356 |
| Guam (GU) | 0 | 1 | 1 |
| Hawaii (HI) | 30 | 12 | 42 |
| Iowa (IA) | 163 | 229 | 392 |
| Idaho (ID) | 51 | 29 | 80 |
| Illinois (IL) | 479 | 190 | 669 |
| Indiana (IN) | 337 | 170 | 507 |
| Kansas (KS) | 140 | 157 | 297 |
| Kentucky (KY) | 136 | 133 | 269 |
| Louisiana (LA) | 194 | 72 | 266 |
| Massachusetts (MA) | 336 | 5 | 341 |
| Maryland (MD) | 196 | 24 | 220 |
| Maine (ME) | 44 | 34 | 78 |
| Michigan (MI) | 315 | 109 | 424 |
| Minnesota (MN) | 198 | 141 | 339 |
| Missouri (MO) | 289 | 198 | 487 |
| Mississippi (MS) | 70 | 132 | 202 |
| Montana (MT) | 19 | 42 | 61 |
| North Carolina (NC) | 298 | 121 | 419 |
| North Dakota (ND) | 25 | 48 | 73 |
| Nebraska (NE) | 64 | 115 | 179 |
| New Hampshire (NH) | 39 | 35 | 74 |
| New Jersey (NJ) | 348 | 0 | 348 |
| New Mexico (NM) | 36 | 32 | 68 |
| Nevada (NV) | 56 | 10 | 66 |
| New York (NY) | 519 | 78 | 597 |
| Ohio (OH) | 699 | 223 | 922 |
| Oklahoma (OK) | 140 | 144 | 284 |
| Oregon (OR) | 107 | 21 | 128 |
| Pennsylvania (PA) | 534 | 123 | 657 |
| Puerto Rico (PR) | 9 | 0 | 9 |
| Rhode Island (RI) | 73 | 0 | 73 |
| South Carolina (SC) | 147 | 40 | 187 |
| South Dakota (SD) | 29 | 67 | 96 |
| Tennessee (TN) | 195 | 108 | 303 |
| Texas (TX) | 860 | 316 | 1176 |
| Utah (UT) | 79 | 18 | 97 |
| Virginia (VA) | 215 | 74 | 289 |
| Vermont (VT) | 8 | 26 | 34 |
| Washington (WA) | 168 | 26 | 194 |
| Wisconsin (WI) | 194 | 129 | 323 |
| West Virginia (WV) | 62 | 61 | 123 |
| Wyoming (WY) | 6 | 30 | 36 |
National Totals
Urban Nursing Centers: 10,701
Rural Nursing Centers: 4,012
Total Nursing Centers: 14,713
What This Distribution Shows
The majority of nursing centers are located in urban areas, reflecting population density and healthcare infrastructure. However, rural facilities remain essential — especially in states with wide geographic coverage and lower population concentration.
States such as Iowa, Kansas, and Oklahoma show a strong rural presence, while highly urbanized regions like New Jersey and Massachusetts concentrate nearly all nursing centers in metropolitan zones.
This balance highlights the importance of both urban healthcare networks and rural access to long-term care services.